Team OS : Your Only Destination To Custom OS !!

Welcome to TeamOS Community, Register or Login to the Community to Download Torrents, Get Access to Shoutbox, Post Replies, Use Search Engine and many more features. Register Today!

Locked CPU 100%? This is normal?

Status
Not open for further replies.

juanamm

Uploader
Uploader
Power User
✅ Verified Member
Member
Downloaded
5.7 GB
Uploaded
448.6 GB
Ratio
78.11
Seedbonus
134,973
Upload Count
217 (223)
Member for 5 years
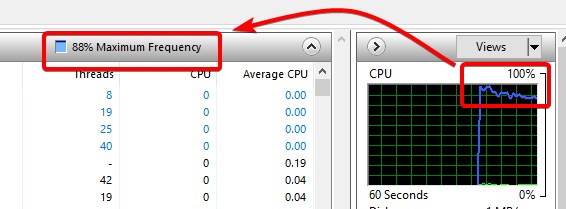
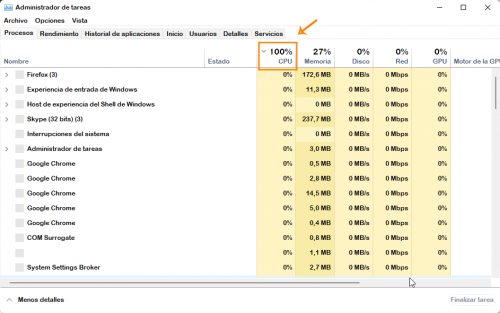
Every time I open the resource monitor I have seen that the CPU was at 100% and immediately it normalizes, but I look at the graphs and I see the following:

cpu.png


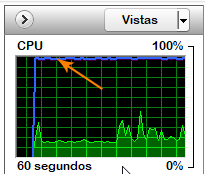
What indicates that blue curve is normal?
 

YZigrin

Member
Downloaded
39.8 GB
Uploaded
5.1 TB
Ratio
129.93
Seedbonus
443,435
Upload Count
0 (0)
Member for 2 years
You have described what shows which chart, and it depends on a few things. Mainly from the BIOS settings, but also from the power plan. If you want to know the Bios settings and overclocking/underclocking/undervolting the processor, you will know why and what shows. And so it's normal, it means that the processor is currently working on full frequency but not full of performance.

edit:

A lazy processor looks like this :
 
Last edited:

Cyler

🤴 Super Admin
⚡OS Master
Downloaded
510.5 GB
Uploaded
24.8 TB
Ratio
49.71
Seedbonus
28,004
Upload Count
1 (1)
Member for 7 years
No, your CPU is not running at 100%. The green graph shows your current CPU usage and the blue shows the max CPU potential available to the system. At 100% means you will have all of your CPU. If you had a different power plan (like power saving) or something else was limiting your CPU max like underclocking, it would reflect that by showing the blue bar lower than 100%.

In my CPU for example, when enabling the auto mode you can see that when the frequency drops due to inactivity, the graph also reflects that.
perfmon_JEbFki0h66.jpg


Hope it helped.
 
Last edited:

juanamm

Uploader
Uploader
Power User
✅ Verified Member
Member
Downloaded
5.7 GB
Uploaded
448.6 GB
Ratio
78.11
Seedbonus
134,973
Upload Count
217 (223)
Member for 5 years
Luckily I was able to take a screenshot quickly, because then that 100% returns to normal (approx 15%) in 1 second:

taskbar.md.png
 

Chuck

🤴 Super Admin
Downloaded
300.6 GB
Uploaded
2.9 TB
Ratio
9.93
Seedbonus
592,998
Upload Count
24 (26)
Member for 5 years
@juanamm,
What you are seeing is perfectly normal.
Whenever you start any new app or open a new window there will be increase in CPU activity for a while.
The difference with the resource monitor is that you can actually see it.

So, the short answer to your question is "Yes, this is normal".
 
Status
Not open for further replies.
Top