- Downloaded
- 135.2 GB
- Uploaded
- 13.1 TB
- Ratio
- 99.13
- Seedbonus
- 256,655
- Upload Count
- 265 (300)
Member for 9 years
[udemy] Statistics & Excel #1-Introduction-A Picture from Data

MP4 | Video: h264, 1280x720 | Audio: AAC, 44.1 KHz, 2 Ch
Genre: eLearning | Language: English | Duration: 44 Lectures ( 15h 41m ) | Size: 11.3 GB
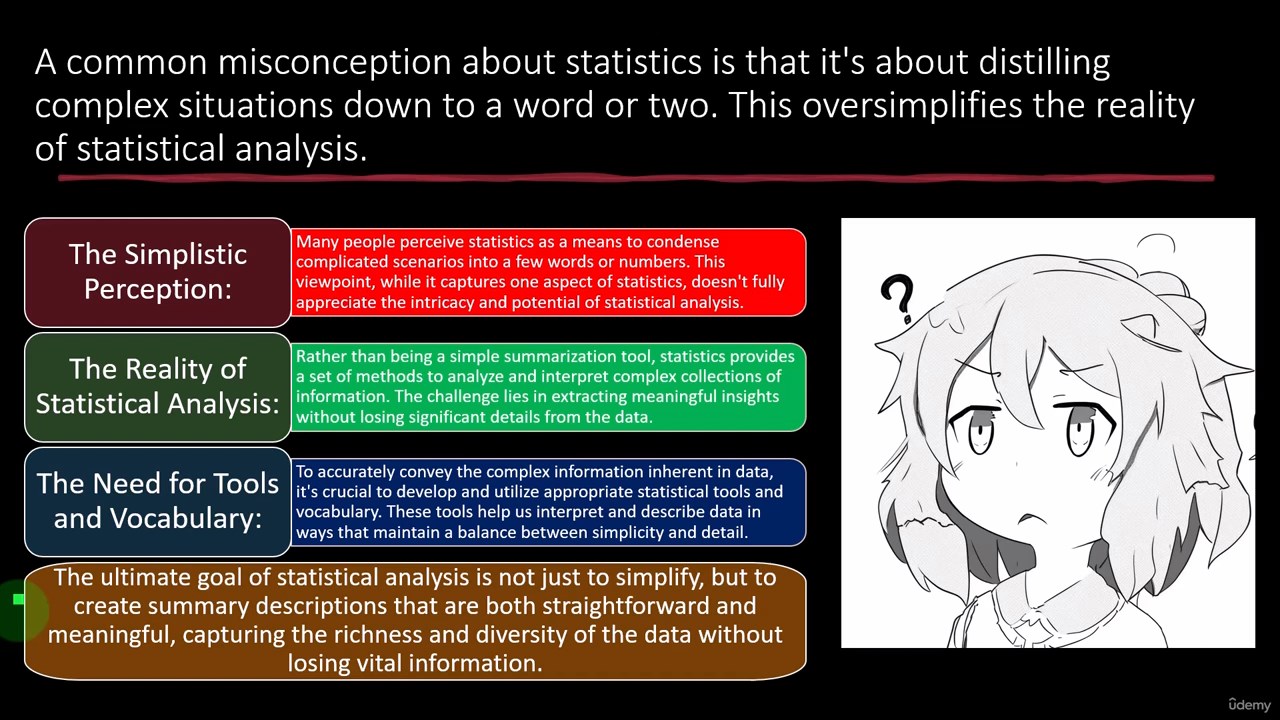
Understanding and Interpreting Data
From Tables to Graphical Representations
What you'll learn
Define Key Data Terms and Sources: Clearly articulate essential terminology
in statistics and identify various data sources
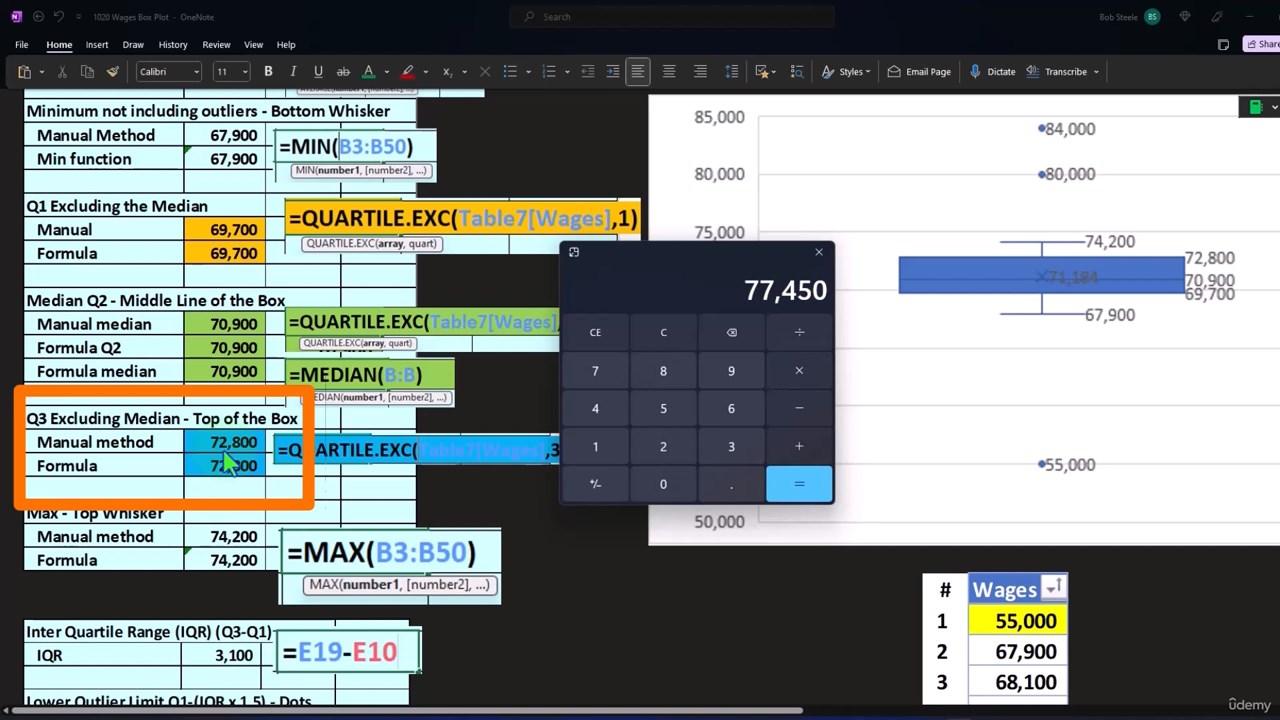
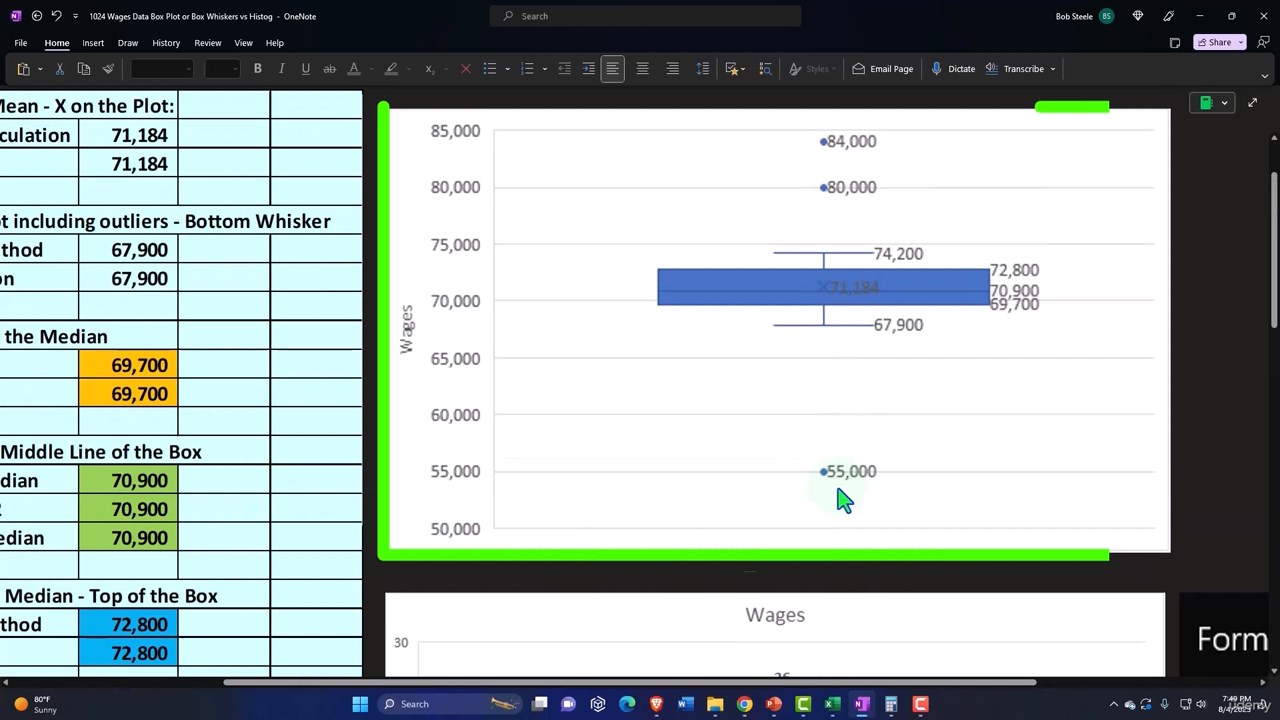
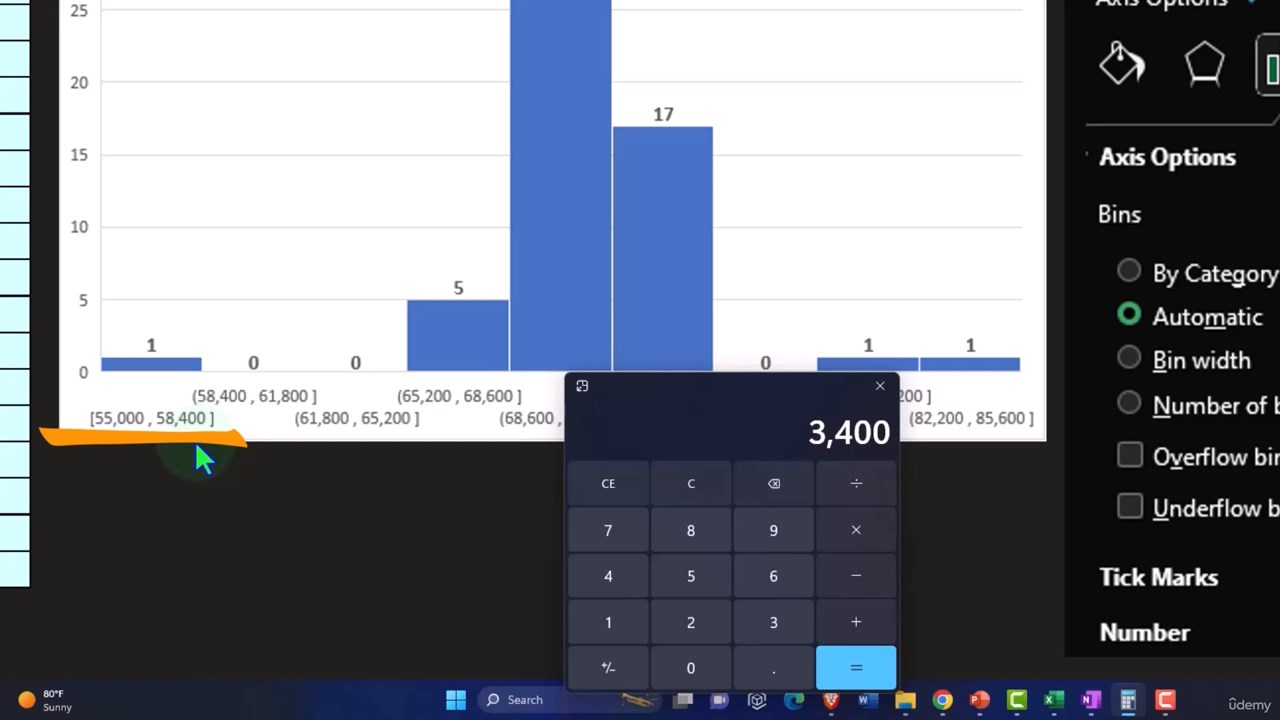
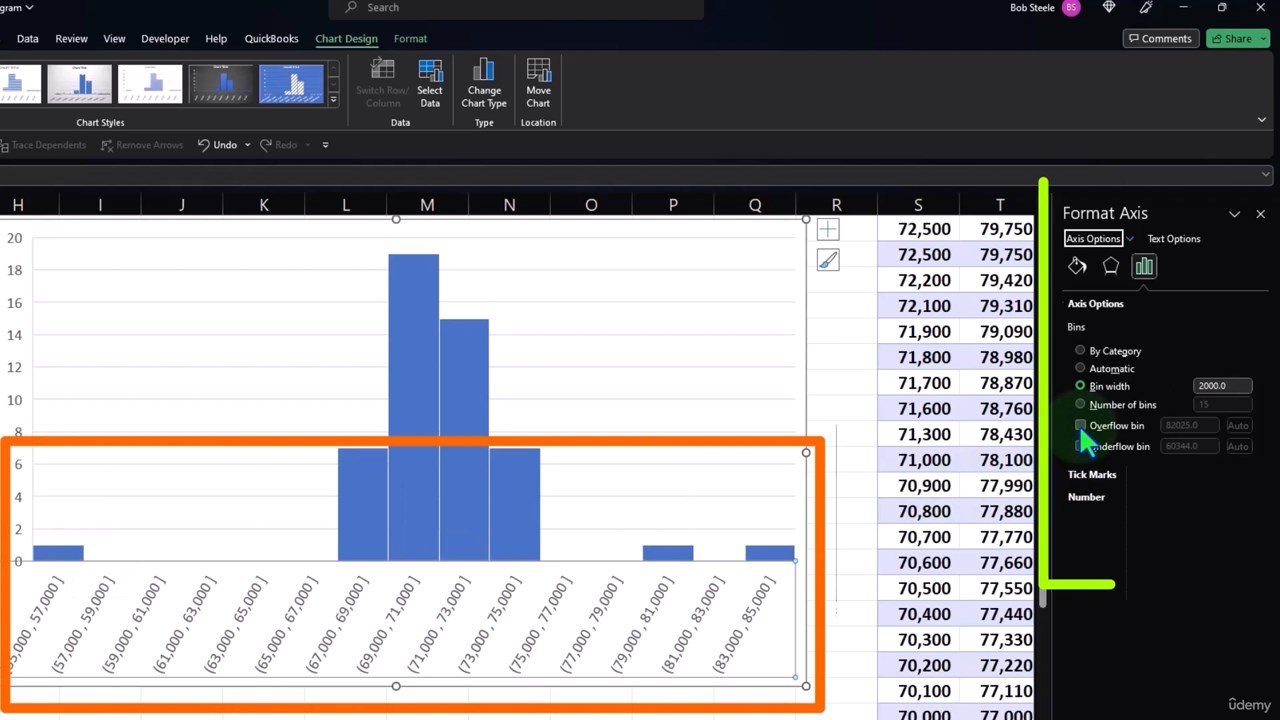
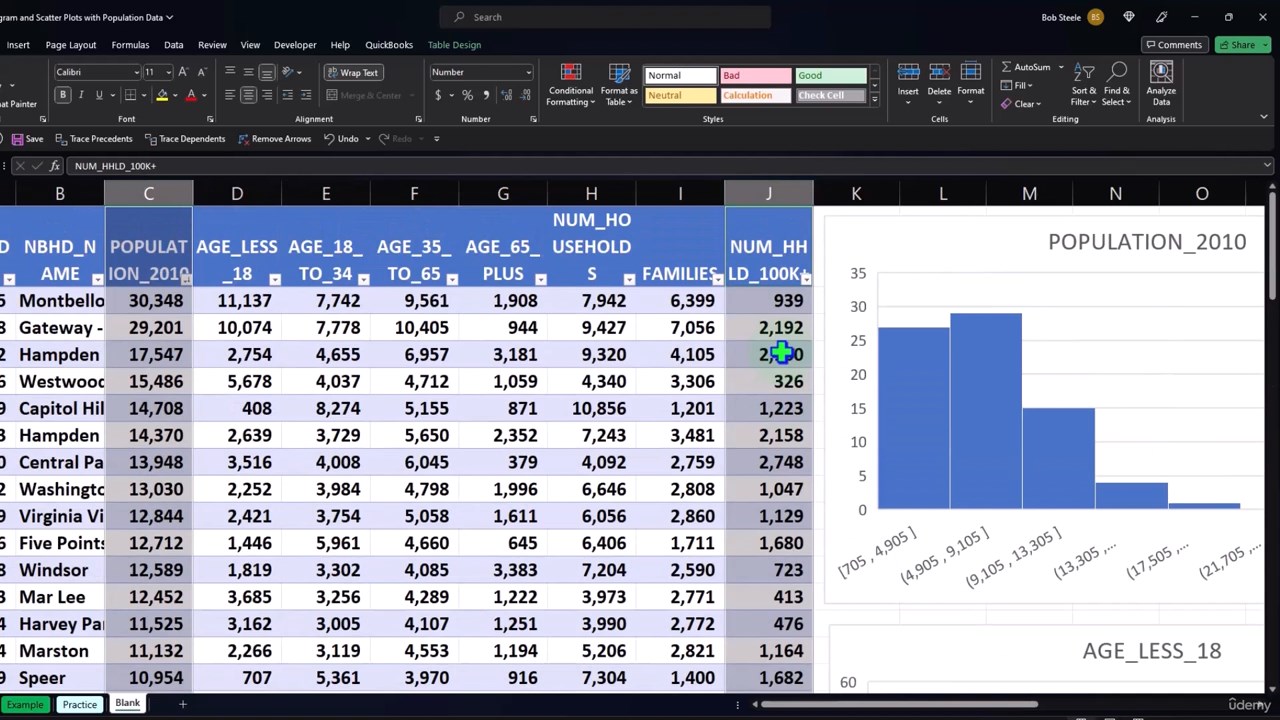
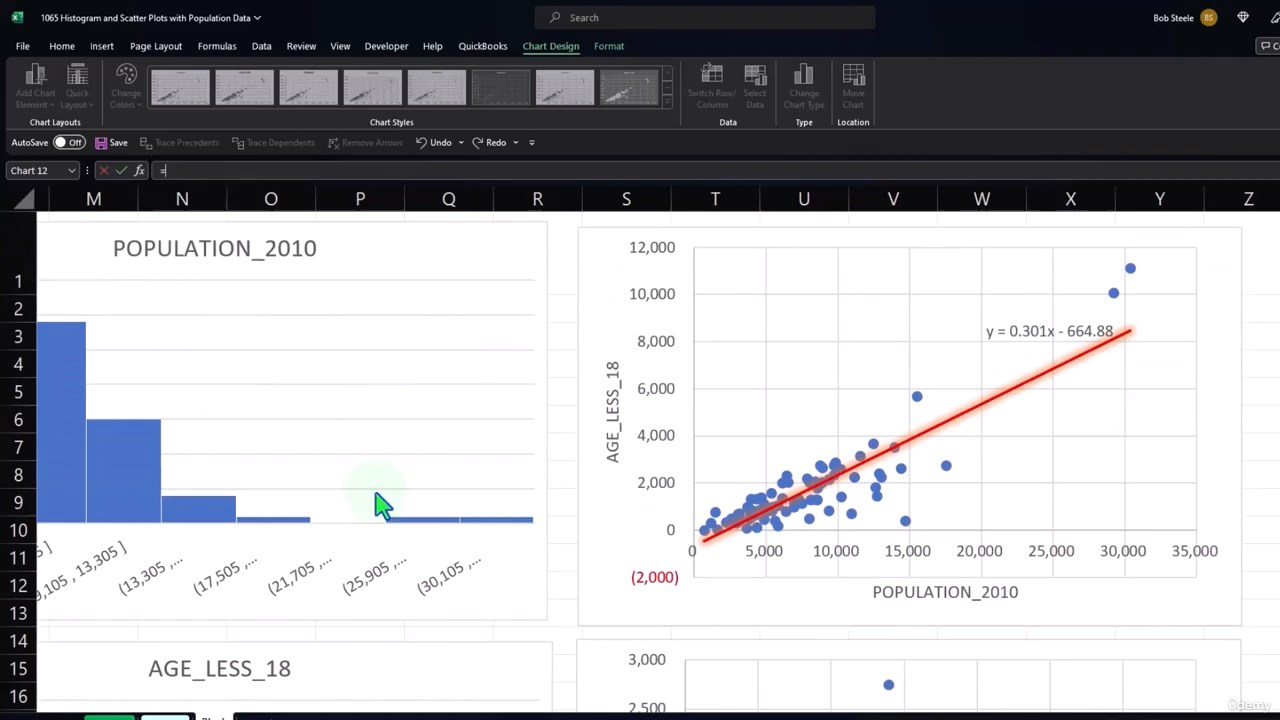
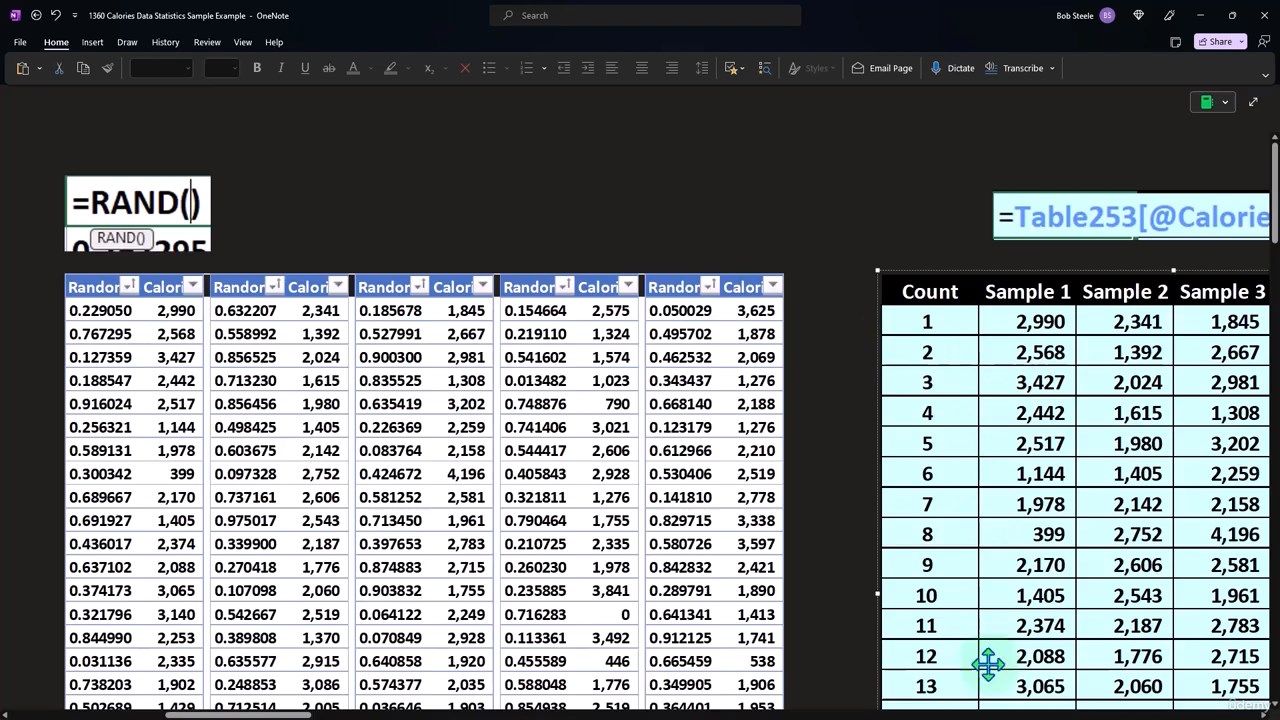
Create and Interpret Data Visuals: Construct graphical representations like histograms, box plots, and scatter plots,
and analyze these visuals to draw meaning
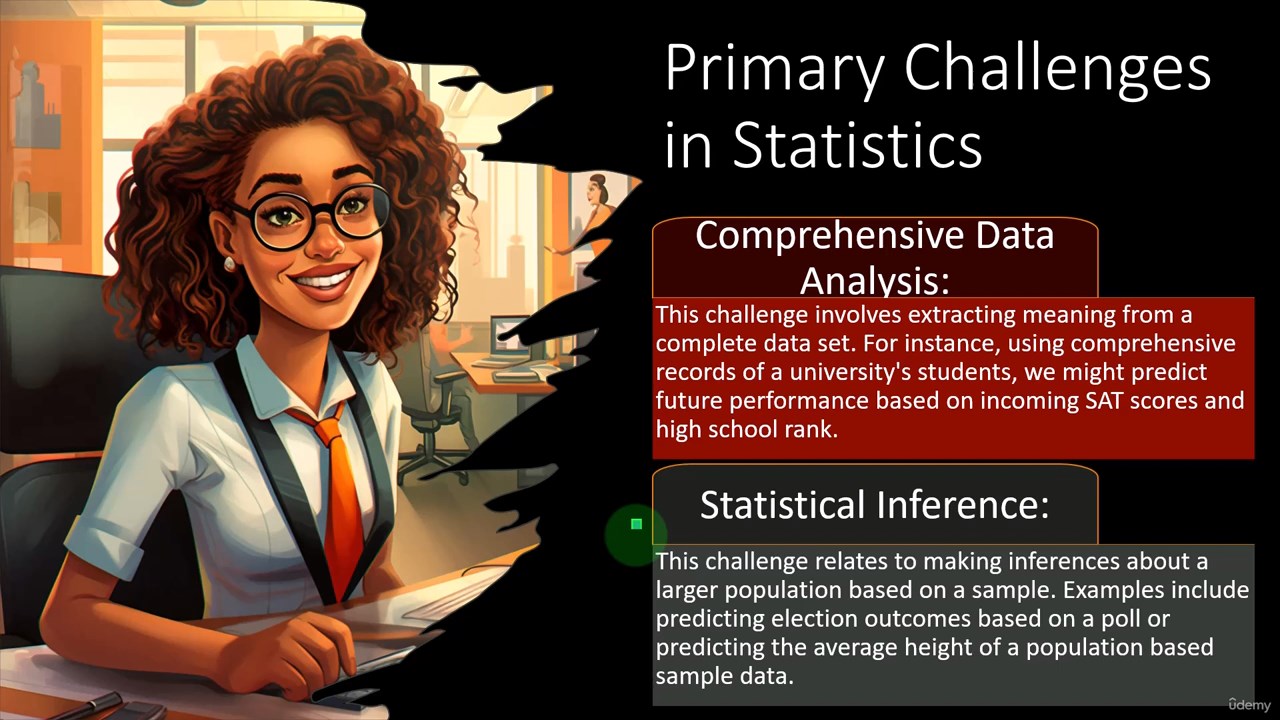
Analyze Data Distributions: Examine and describe the shape, center, and spread of different data sets,
identifying patterns and potential outliers.
Summarize Data with Statistical Measures: Calculate and interpret central tendency measures (mean, median, mode)
and variability measures (range, variance. . .
Examine Variable Relationships: Investigate relationships between two or more variables using correlation
and regression analysis, interpreting the results
Critique Data Interpretations: Evaluate the validity of data interpretations,
identifying potential biases or misuses of statistical methods.
Communicate Data-Driven Insights:Clearly and effectively communicate findings from data analysis,
utilizing appropriate visual and textual mediums.
Avoid Misuse of Data: Recognize common pitfalls and ethical considerations in data analysis, ensuring responsible
and accurate use of statistical methods.
Apply Statistics in Real-World Scenarios: Demonstrate the application of statistical concepts in various fields,
such as medicine, finance, and social sciences.
Adapt to New Data Analysis Trends: Stay informed about emerging trends and tools in data analysis,
demonstrating adaptability and continuous learning
Requirements
Technical Proficiency: Basic computer skills
Access to Resources: Reliable internet connection and access to a computer for online research, software usage,
and accessing course materials.
Critical Thinking: An open mind and critical thinking skills to analyze data, question assumptions,
and consider various interpretations of statistical findings.
Self-Motivation: A proactive attitude and self-motivation to engage with the course materials,
seek help when needed, and strive for continuous improvement in understanding statistics.
Who this course is for
This course is designed for undergraduate students who are interested in gaining a comprehensive understanding of statistics,
particularly in its application to real-world data and scenarios across various domains such as medicine, finance, education, and social sciences.
It is suitable for students from a wide range of disciplines who want to enhance their data analysis skills,
learn how to interpret complex data sets, and communicate their findings effectively.
The course is also appropriate for individuals looking to strengthen their quantitative skills,
as it covers essential statistical concepts and provides practical experience with statistical software.
Students pursuing careers in business, healthcare, research, public policy, or any field where data-driven decision making is crucial will find
this course particularly beneficial.
Additionally, the course is a good fit for those who have a curiosity about the world and a desire to make informed decisions based on data,
as well as those who are critical thinkers and have an ethical mindset when it comes to data analysis and interpretation.
Download
FreeDL
UsersDrive
ClicknUpload
MP4 | Video: h264, 1280x720 | Audio: AAC, 44.1 KHz, 2 Ch
Genre: eLearning | Language: English | Duration: 44 Lectures ( 15h 41m ) | Size: 11.3 GB
Understanding and Interpreting Data
From Tables to Graphical Representations
What you'll learn
Define Key Data Terms and Sources: Clearly articulate essential terminology
in statistics and identify various data sources
Create and Interpret Data Visuals: Construct graphical representations like histograms, box plots, and scatter plots,
and analyze these visuals to draw meaning
Analyze Data Distributions: Examine and describe the shape, center, and spread of different data sets,
identifying patterns and potential outliers.
Summarize Data with Statistical Measures: Calculate and interpret central tendency measures (mean, median, mode)
and variability measures (range, variance. . .
Examine Variable Relationships: Investigate relationships between two or more variables using correlation
and regression analysis, interpreting the results
Critique Data Interpretations: Evaluate the validity of data interpretations,
identifying potential biases or misuses of statistical methods.
Communicate Data-Driven Insights:Clearly and effectively communicate findings from data analysis,
utilizing appropriate visual and textual mediums.
Avoid Misuse of Data: Recognize common pitfalls and ethical considerations in data analysis, ensuring responsible
and accurate use of statistical methods.
Apply Statistics in Real-World Scenarios: Demonstrate the application of statistical concepts in various fields,
such as medicine, finance, and social sciences.
Adapt to New Data Analysis Trends: Stay informed about emerging trends and tools in data analysis,
demonstrating adaptability and continuous learning
Requirements
Technical Proficiency: Basic computer skills
Access to Resources: Reliable internet connection and access to a computer for online research, software usage,
and accessing course materials.
Critical Thinking: An open mind and critical thinking skills to analyze data, question assumptions,
and consider various interpretations of statistical findings.
Self-Motivation: A proactive attitude and self-motivation to engage with the course materials,
seek help when needed, and strive for continuous improvement in understanding statistics.
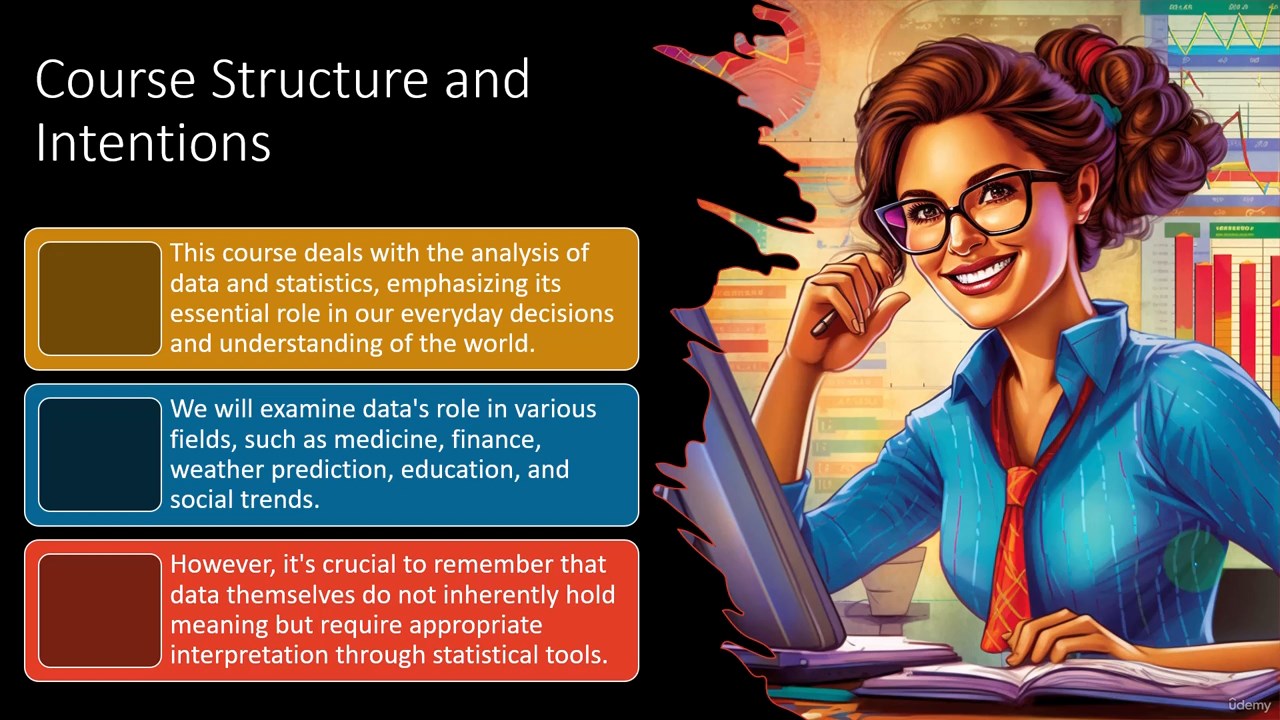
This statistics course is designed to immerse students in the world of statistics,
focusing on the critical skills of organizing, analyzing, and interpreting data.
Throughout the course, students will learn to navigate the complexities of various data sets collected by entities such as governments,
businesses, universities, and sports enthusiasts, transforming extensive numerical tables into meaningful information.
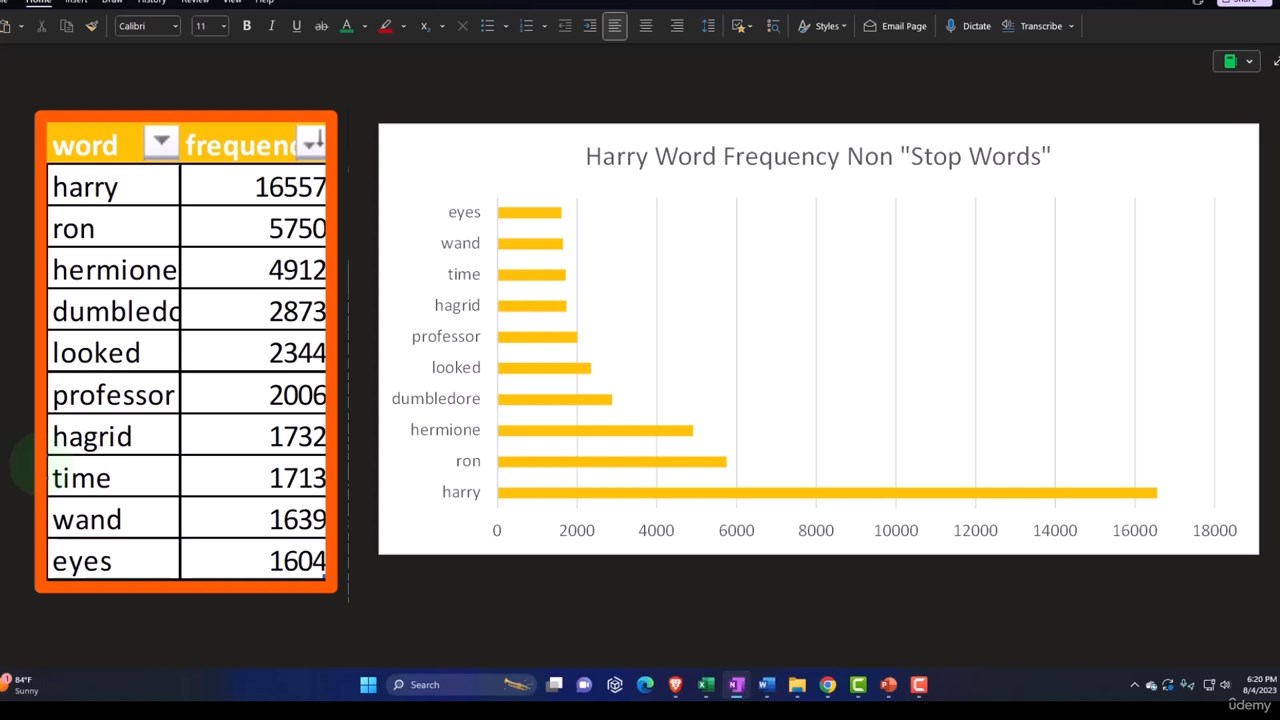
The course kicks off by highlighting the indispensable role of visual representations in statistics.
Students will learn that the first rule of statistics is to "draw a picture," understanding that graphs and charts are powerful tools
that can unveil patterns, relationships, and crucial features within data.
Through practical examples, students will observe how visual representations can indicate the distribution of a variable, pinpoint unexpected outliers, or depict associations between two variables, all while serving as an effective communication tool to convey the stories hidden within the data.
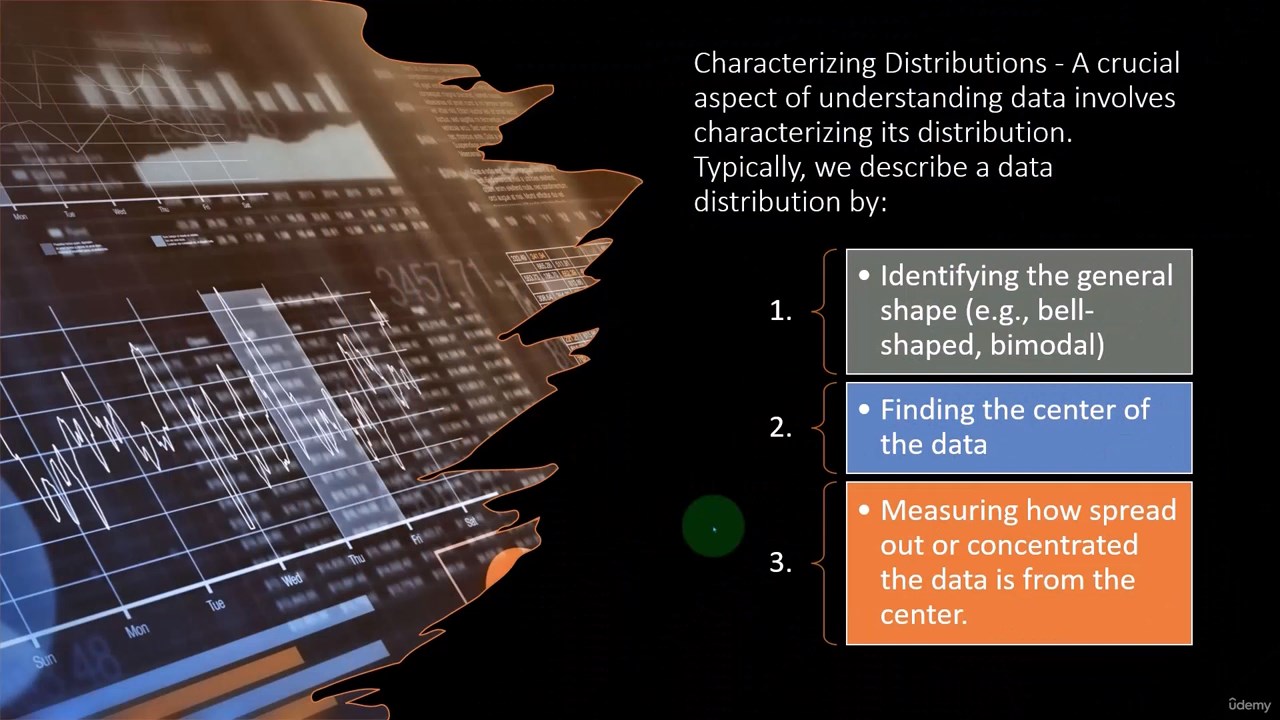
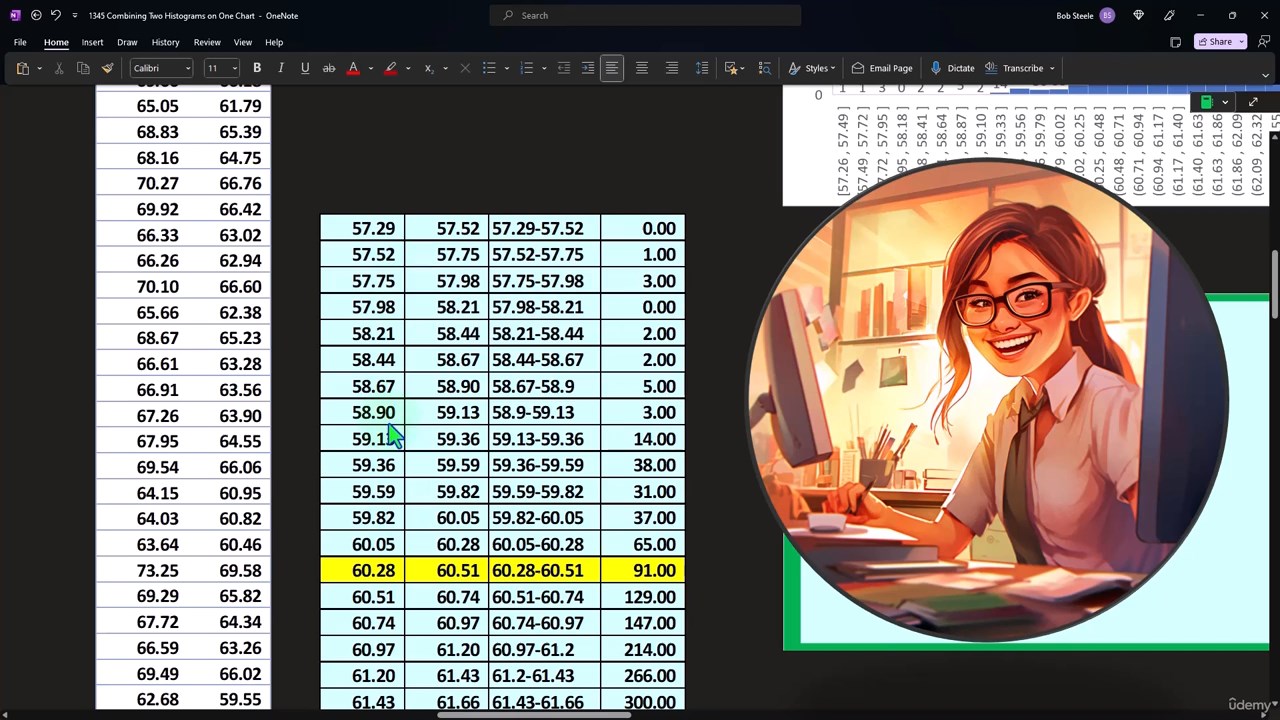
A significant portion of the course is dedicated to characterizing distributions. Students will master the art of describing data distributions
by identifying their general shapes, finding the center, and measuring the spread of data from the center.
The course ensures that students become proficient in ordering and grouping data efficiently,
summarizing it with single numbers such as the mean or median, identifying quartiles,
and creating graphical representations like histograms and box plots.
Furthermore, the course delves into the relationships between two or more variables,
teaching students to visualize these associations through scatter plots and other graphical tools.
By the end of the course, students will have a solid understanding of how to organize, describe,
and summarize data sets, looking beyond the surface to analyze various shapes and relationships within the data.
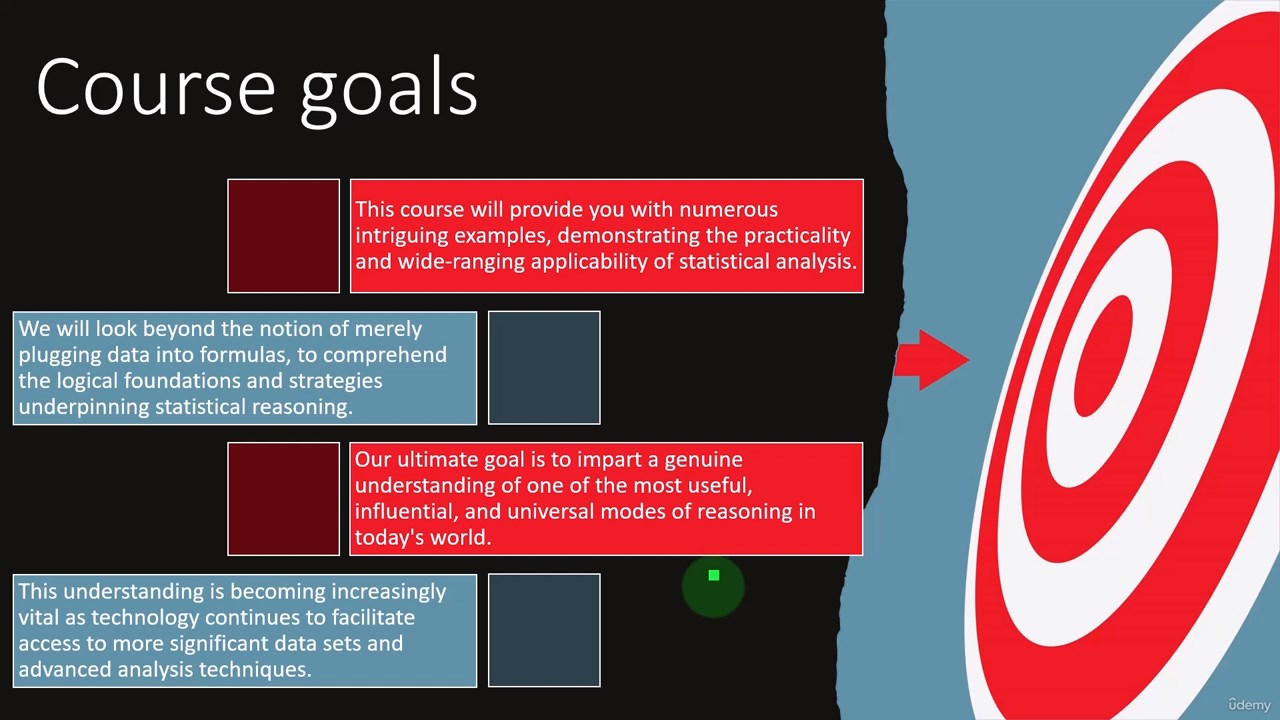
By blending theoretical knowledge with practical application, this course ensures
that students not only learn the fundamental concepts of statistics but also develop the ability
to apply these concepts in real-world scenarios.
Students will leave the course with a comprehensive toolkit for understanding and interpreting data,
ready to tackle the challenges of making sense of the vast sea of numbers encountered in various fields.
focusing on the critical skills of organizing, analyzing, and interpreting data.
Throughout the course, students will learn to navigate the complexities of various data sets collected by entities such as governments,
businesses, universities, and sports enthusiasts, transforming extensive numerical tables into meaningful information.
The course kicks off by highlighting the indispensable role of visual representations in statistics.
Students will learn that the first rule of statistics is to "draw a picture," understanding that graphs and charts are powerful tools
that can unveil patterns, relationships, and crucial features within data.
Through practical examples, students will observe how visual representations can indicate the distribution of a variable, pinpoint unexpected outliers, or depict associations between two variables, all while serving as an effective communication tool to convey the stories hidden within the data.
A significant portion of the course is dedicated to characterizing distributions. Students will master the art of describing data distributions
by identifying their general shapes, finding the center, and measuring the spread of data from the center.
The course ensures that students become proficient in ordering and grouping data efficiently,
summarizing it with single numbers such as the mean or median, identifying quartiles,
and creating graphical representations like histograms and box plots.
Furthermore, the course delves into the relationships between two or more variables,
teaching students to visualize these associations through scatter plots and other graphical tools.
By the end of the course, students will have a solid understanding of how to organize, describe,
and summarize data sets, looking beyond the surface to analyze various shapes and relationships within the data.
By blending theoretical knowledge with practical application, this course ensures
that students not only learn the fundamental concepts of statistics but also develop the ability
to apply these concepts in real-world scenarios.
Students will leave the course with a comprehensive toolkit for understanding and interpreting data,
ready to tackle the challenges of making sense of the vast sea of numbers encountered in various fields.
Who this course is for
This course is designed for undergraduate students who are interested in gaining a comprehensive understanding of statistics,
particularly in its application to real-world data and scenarios across various domains such as medicine, finance, education, and social sciences.
It is suitable for students from a wide range of disciplines who want to enhance their data analysis skills,
learn how to interpret complex data sets, and communicate their findings effectively.
The course is also appropriate for individuals looking to strengthen their quantitative skills,
as it covers essential statistical concepts and provides practical experience with statistical software.
Students pursuing careers in business, healthcare, research, public policy, or any field where data-driven decision making is crucial will find
this course particularly beneficial.
Additionally, the course is a good fit for those who have a curiosity about the world and a desire to make informed decisions based on data,
as well as those who are critical thinkers and have an ethical mindset when it comes to data analysis and interpretation.
Download
FreeDL
You must be registered for see links
You must be registered for see links
You must be registered for see links
You must be registered for see links
You must be registered for see links
You must be registered for see links
UsersDrive
You must be registered for see links
You must be registered for see links
You must be registered for see links
You must be registered for see links
You must be registered for see links
You must be registered for see links
ClicknUpload
You must be registered for see links
You must be registered for see links
You must be registered for see links
You must be registered for see links
You must be registered for see links
You must be registered for see links